PieSpy Social Network Bot
Inferring and Visualizing Social Networks on IRC
PieSpy is an IRC bot that monitors a set of IRC channels. It uses a simple set of heuristics to infer relationships between pairs of users. These inferrences allow PieSpy to build a mathematical model of a social network for any channel. These social networks can be drawn and used to create animations of evolving social networks.
PieSpy has also been used to visualize Shakespearean social networks. This page got slashdotted on 11 March 2004, with the site getting 250,000 hits per hour. Thanks to Notnet for making sure it all stayed alive!
PieSpy was presented at the Information Visualization conference (IV'04) in July 2004. Read the full paper online. It has also appeared in Computer Weekly, c't magazine, and I was interviewed live on BBC Radio Kent.
Download PieSpy
Please note that these downloads are subject to change and represent the current state of the PieSpy implementation in Java. Java 1.4 or greater is required.
- PieSpy-0.4.0.zip (Full Java implementation with source-code)
New in 0.4.0: Now tracks nickname changes. Generates images five times faster. Removes formatting and colors from messages. The source code has been refactored to make it easy to add new InferenceHeuristics, which are used to work out who is talking to whom - if you create any good ones, let me know! The config file lets you apply different weightings to each InferenceHeuristic.
New in 0.2.4: You can now change the edge and border colors. Can be told which character encoding to use. Made the output look a bit prettier.
New in 0.2.2: Made it possible to remove nodes from the graph at runtime, using the remove or ignore command. Fixed a small bug in the inference engine.
New in 0.2.0: Bot now saves its state so it can be restarted without losing the information in the graphs. Can now specify a different config file on the command line so running multiple instances is easier. Can now connect to password-protected IRC servers. Removed SVG output. Administrator can tell the bot to send raw messages to the server. Improved drawing parameters.
New in 0.1.8: Now works correctly in channels with ! and
+ prefixes.
New in 0.1.6: Added a configuration file to make all the settings easy to change, such as colors and other output options. Added a shell script for Unix/Linux users to start the bot. Can specify IRC server port number. Administrator password stops random people taking control of the bot. An ignore set lets you configure the bot to ignore other bots or abusive users. Limited support for generating SVG animations if you examine the code (off by default).
New in 0.1.4: Latest image for each channel is saved as channel-current.png in addition to being archived. PieSpy can be told to part channels. Each frame number is now 8 digits instead of 4.
New in 0.1.2: Temporal decay naturally limits the size of the network. Fixed a bounding box calculation. Diagrams of multiple channels are stored in their own directories.
If you run PieSpy in a non-graphical environment (e.g. a Unix console that
does not have access to an X server) you will need to pass the following
command line parameter to java: -Djava.awt.headless=true.
Note that PieSpy may not function properly on FreeBSD. This is because
Java on FreeBSD handles floating point calculations incorrectly.
Abstract
Internet Relay Chat is a system that allows groups of people to collaborate and chat from anywhere in the world. Clearly defined by several RFC documents, it is arguably the most standard real-time chat system currently in use. This paper describes a method of inferring the social network of a group of IRC users in a channel. An IRC bot is used to monitor a channel and perform a heuristic analysis of events to create a mathematical approximation of the social network. From this, the bot can produce a visualization of the inferred social network on demand. These visualizations reveal the structure of the social network, highlighting connectivity, clustering and strengths of relationships between users. Animated output allows viewers to see the evolution of the social network over time. Some novel ideas for future work are discussed, showing other useful applications of this system.
Please note that the following was written a relatively long time ago (2003) and it does not accurately reflect the current implementation of the software, which has since been improved.
Keywords: inferring social networks, visualization, animation, irc bot, heuristics, internet relay chat, spring embedder
Introduction to IRC
Internet Relay Chat is used by millions of people to communicate in real-time across the world. An IRC network consists of a set of servers that people can use to connect to IRC. Each network typically consists of several servers, which helps to increase the performance and resilience of the system. Since its introduction by Jarkko Oikarinen in 1988, IRC has steadily grown in popularity and currently has more than a million users at any one moment worldwide [Gel2003]. The IRC protocol was clearly defined 5 years later in RFC 1459 [Oik1993], which made the system more accessible. As a result of this, there are now many client programs that users can use to connect to an IRC network.
IRC Channels
In addition to sending messages directly from one user to another, IRC users can join a set of channels, which are analogous to rooms. When a message is sent to a channel, all other users in the channel can see it. Each channel has a unique name and is usually inhabited by users with a common interest. Much like a real room, it is possible to infer social interactions between the users in a channel. This paper describes a simple method of inferring a social network by monitoring an IRC channel and producing visualizations of the resulting data.
Social Network Analysis
Social network analysis [Kre2002] concerns itself with the measuring of relationships and flows between entities. We are able to model an IRC channel as a social network, as each individual user is an entity and their interactions imply relationships and flows. Such social networks can provide a mathematical analysis of the relationships in an IRC channel, yet visual representations are often easier to comprehend. The network is modeled as a graph, consisting of a set of nodes and edges, where each node represents a user and an edge represents a relationship between a pair of nodes, as shown in Figure 1.
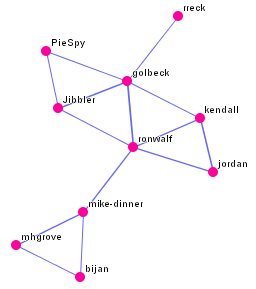
Figure 1. A simple social network
Visualization of Social Networks
Visualization of social networks is important, as it allows the viewer to determine facts about nodes and relationships between nodes more rapidly than examining the raw mathematical model. For example, the prominence of a node in the network can be determined by its centrality, which is easy to see in a visualization of a social network.
Inferring Social Networks
A social network is virtually present whenever we observe a group of people interacting electronically [Wel1997]. The first step in visualizing the social network of an IRC channel is to infer the approximate mathematical representation. Identifying the nodes in the graph is a trivial task, as these simply correspond to the users in the channel. Identifying the presence of edges is slightly more difficult, as this can only be done by monitoring the activity in the channel and identifying specific classes of user interactions. Furthermore, we enhance our social network model by assigning weightings to each edge to show the strength of each relationship.
Analogous Heuristics
Fortunately, there are some fairly simple heuristics that enable us to obtain reasonably accurate approximations of the data required to produce the social network, most of which are analogous to inferring social networks from real life conversations. It must be noted that the accuracy of these approximations is very subjective by nature and that the social network derived from the heuristics can be no more than a good guess. However, in practice, we find that the results are generally good. We call this first stage inferring the social network.
Inferring Relationship Strengths
An IRC bot is used to monitor channels and infer the social network structure for us (The term bot is commonly used to describe an automated IRC client and is a contraction of robot). The bot is called PieSpy and has been implemented in Java using the PircBot IRC Bot Framework [Mut2001]. The bot is instructed to join a channel and examine the messages and actions sent to the channel. Each user has a unique nickname (or nick) and each message includes a source nick so it is possible to tell which user it came from. To begin with, the inferred graph contains only a set of nodes to represent the users in a channel. All that remains is for us to build the set of weighted edges.
Direct Addressing of Users
The first simple method we use to infer relationships in the graph is to monitor occurrences of direct addressing. This is where a user attempts to target a channel message to another user by specifying their nick, as shown in Figure 2. This is a very common observation in a channel and usually involves the target nick being stated before the actual message, often separated by a colon or other punctuation. This is a simple yet reliable way of building the set of edges in the graph, but it works best in conjunction with other methods.
<Dave> Can someone ping me?
<Phil> Dave: Okay.
Figure 2. An example of direct addressing
Temporal Proximity
Direct addressing is not always used (or required) to specify the target of a message. A message without explicit direct addressing is either targeted to everybody in the channel, or it is targeted to an individual user. Analogous to a real life conversation, if there is a long period of silence before a user sends a message and this message is immediately followed up by a message from another user, then it is reasonable to imply that the second message was in response to the first. The fact that the second message was probably a response to the first allows us to infer a relationship between the two users.
Temporal Density
If there are no long delays in a channel's conversation, it is still possible to derive clues about the structure of the social network by examining other temporal features. If the last n messages have been sent within a short time span and all n of these messages originate from only two users, then it is reasonable to assume that these two users are engaged in conversation. We find that values of n > 5 allow us to build the set of edges and their weightings in the graph fairly accurately.
Monitoring Private Messages
Each IRC user is able to bypass channel discussions and send messages directly to other users. This is the strongest and most accurate indication of a relationship between sender and recipient. Our bot does not implement this heuristic, as it would require special access to the servers that make up an IRC network and raises strong ethical debate about the privacy of users. As users may also be in more than one channel, it is not a valid method of inferring a social network for an individual channel.
Monitoring Nick Changes
Another difficultly in inferring the social network for a channel is that users may change their nick at any time. It is therefore necessary to track such nick changes and model these nicks as belonging to the same user. Alternatively, each nick can be treated as a different user to see if a user's nick has any effect on their role in the social network.
Examining the Inferred Social Network
Before we visualize the inferred social network, it is possible to calculate results and draw conclusions by examining the graph theoretic structure.
Degrees and Strengths
Nodes with many emanating edges represent the most active users in the social network. Working out which users are most active can also involve looking at the weighting of each edge, as these represent the strength of each relationship. The strongest relationships in the social network are represented by the edges with the highest weightings. This can be determined quantitatively by examining the graph, but a visualization of the social network is also adept at highlighting such features.
Disconnected Social Networks
It is possible that the inferred social network does not form a connected graph. Several graph algorithms can be used to detect whether or not the social network is disconnected. A disconnected social network is a useful indication of there being distinct groups of users in the same channel that do not communicate with each other. Each group is a maximally connected component of the social network and these can be found using simple recursive graph algorithms. This information can have a variety of useful applications, such as allowing IRC clients to provide automatic filtering of irrelevant messages or to highlight the fact that a channel may function better if it were to be split into several new channels.
Drawing Social Networks
After we have inferred the social network for an IRC channel, we are ready to begin the creation of the visualization. This is essentially a graph drawing problem, as we wish to obtain a layout of the nodes and edges of the graph that represents the social network. The layout should not only portray which relationships are present, but also the strength of those relationships. It is convenient to produce a two-dimensional layout, as we do, because it is most versatile in terms of both screen display and printing hard copies.
Multidimensional Embedding
Dense social networks may be more effectively visualized in three dimensions. Using three dimensions allows large graphs to be navigated more effectively than using only two dimensions, with advantageous usability issues in spatial navigation, layout and semiotics [Mun1995, Par1998, Wil1999]. Although our method of embedding the graph can deal with three dimensions, this adds complexity to the requirements of viewing software. Furthermore, hard copies are only able to display a single two dimensional projection viewpoint of the social network, which may result in confusion brought about by occlusions. The social networks that we derive from IRC channels typically contain between 10 and 100 active users, so two dimensions are very much adequate for these visualizations. Note that we do not concern ourselves with displaying maximally connected components if they consist of a single node, that is, we do not draw users that exhibit no relationship behaviour whatsoever. We call these inactive users.
Meaningful Drawings
It is important to make the resultant drawing meaningful. Some desired characteristics are that related users should be close to each other and highly related users should be even closer together. Conversely, it is undesirable for any pair of nodes to be too close to each other, as it becomes difficult to interpret the graph when there are a number of node-node occlusions present.
Spring Embedder
The spring embedder [Ead1984] is one such graph drawing method that is suitable for application to social networks. Its effect is to distribute nodes in a two-dimensional plane with some separation, while attempting to keep connected nodes reasonably close together. The spring embedder graph drawing process considers the graph model as a force system that must be simulated. Each node in the graph is modelled as a charged particle, thereby causing a repulsive force between every pair of nodes. Each edge is modelled as a spring that exerts an attractive force between the pair of nodes it connects. A graph is laid out by repeated iterations of a procedure that calculates the repulsive and attractive forces acting on all nodes in the graph. At the end of each iteration step, all nodes are moved according to the resultant forces acting on them.
Modified Spring Embedder Force Model
The force models that we use for the spring embedder are based on those of Fruchterman and Reingold [Fru1991]. This version of the spring embedder is effective and widely used. It is also relatively easy to implement and requires a minimal set of parameter values that can be adjusted to achieve good automatic layouts. In this model, the repulsive force acting on a pair of nodes is -k2/d and the attractive force between two nodes caused by an edge is d2/k, where d is the distance between two nodes and k is a constant. With this force model, it is worth noting that an edge connecting the only pair of nodes in a graph will have a natural length of k.
Two-dimensional Embedding
We start the graph drawing process by allocating each node to a random location on a two-dimensional plane. The iterative calculation of the forces begins and nodes are moved accordingly at the end of each iteration step. This results in a layout where connected nodes are close together, yet no pair of nodes are too close to each other due to the repulsive forces acting between them.
m-limited Force Model
As some social networks may be disconnected, the simple spring embedder model described above can cause the layout to expand rapidly, as there is nothing to counter the repulsive forces acting between each maximally connected component. Limiting the distance over which repulsive forces may act easily solves this problem. The force model is modified so that a pair of nodes with separation greater than m does not exert a repulsive force [Mut2003a]. This alteration to the force model ensures that we do not end up with an unnecessarily sparse graph drawing.
Representing Edge Weights
To make the resultant graph drawing convey information about the strengths of relationships, we change the attractive forces caused by edges. These are altered so that the calculated attractive force is multiplied by the weight of the edge, causing strongly related nodes to be even closer together. Another effective way of representing the strength of a relationship is to make the edge thickness proportional to its weight. This is used in conjunction with the length of edges to provide a redundant cue to the person viewing the visualization. Color and opacity are other variables used in the implementation of PieSpy, which add further redundant emphasis, but the examples in this paper do not use this for clarity. In many cases, we have observed that a large variance of edge weights can cause the layout to become very distorted and the edge thicknesses become too great. This makes it difficult to navigate the layout, so we multiply the calculated attractive force by log(weight)+1. This causes stronger relationships to have shorter edges still, but lessens the effect when relationship strengths get greater. This seems to be an effective compromise, resulting in layouts that are easy to navigate and understand.
Performance Requirements and Optimizations
A graph, G = (N,E), is modelled as a set of nodes and edges. A simple implementation of the spring embedder calculates the repulsive force between every pair of nodes and so has a time complexity of O(|N|2) per iteration. In practical terms, this limits the maximum size of the social network to several hundred nodes if we want it to be laid out in less than one second on affordable hardware. Various optimisations exist to make this process quicker, such as preprocessing the initial random layout with linear time complexity [Mut2002], speeding up the calculation of forces between pairs of nodes [Tun1998], or reducing the number of nodes that are paired [Qui2001, Tun1998]. Multi-level [Har2001, Wal2001] approaches provide a heuristic method that clusters a graph and lays out the coarsened graph, reintroducing the other nodes in uncoarsening steps until a final layout is produced. These can be used to reduce the time complexity of each spring embedder iteration to O(|N|log|N|) without any significant reduction in its effectiveness, making the method suitable for application to graphs with tens of thousands of nodes in real-time.
Implementation
The current implementation of the IRC bot does not use any optimisations when calculating forces, as the size of each social network is typically small enough to allow the drawing to be generated each time the underlying social network changes, taking no more than one second.
Using the IRC Bot
While the IRC bot is in a channel, other users can instruct it to draw social network diagrams on demand, as shown in Figure 3. It then sends a PNG (Portable Network Graphics) file to the user that requested the diagram. It can also generate high quality EPS (Encapsulated Postscript) output if required. The drawing corresponds to the inferred social network at the time of the request.
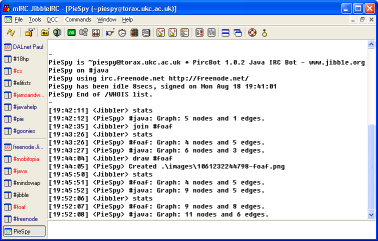
Figure 3. Interacting with PieSpy
Animation of Social Networks
Each time a social network diagram is drawn by the IRC bot, the position of each node is stored. When the next diagram is drawn, the previous layout is used as a starting point so that the resultant drawing differs only slightly. This helps to preserve the mental map of the diagram as it evolves. If a diagram is generated each time the underlying social network changes, then all of these diagrams can be pieced together to form an animation of the evolving social network. The evolution of a social network diagram of a moderately busy channel over a 12-hour period can be demonstrated by about 10 megabytes of MPEG video. Some still frames and MPEG animations are available from the PieSpy web site [Mut2003b].
Temporal Decay
Each social network diagram that is drawn relates to a particular moment in time. Each diagram is, in essence, a snapshot of the social network during its evolving inference. Another real life analogy plays a part in the reason for applying temporal decay to the social network. The general idea is that a relationship deteriorates over time if it remains inactive. Each time the structure of the social network changes, all edges have their weightings reduced by a small amount to simulate this real life analogy. This results in social network diagrams that are more accurate for the time at which they are created, giving preference to recent and prolonged activity. A nice side effect is that inactive users gradually disappear from the diagram, naturally limiting the size of the graph to reasonable bounds.
Experimental Results
The IRC bot was tested on both private and public IRC servers. The results shown here relate to a public channel on a public server, as this is information easily available to anybody. The IRC bot was instructed to join the channel #java, which is a moderately busy channel used to discuss Java programming on the freenode IRC network.
Example Output
Figure 4 shows the visualization of the inferred social network after a short time in the channel. Inactive users are not displayed in the diagram. This diagram shows several interesting features already.
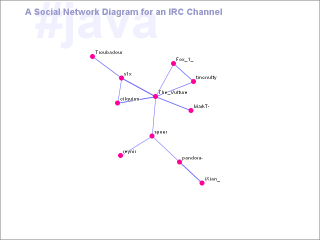
Figure 4. A simple social network for #java
We are able to ascertain "The_Vulture" as having high centrality in the network. This user has a high degree, linking directly to several other users. This user also has a high level of betweenness, which means it has an influence over what flows in the network. It also exhibits a high level of closeness, with short paths to everywhere else in the network. Removing this user from the network would create a sparse, disconnected graph.
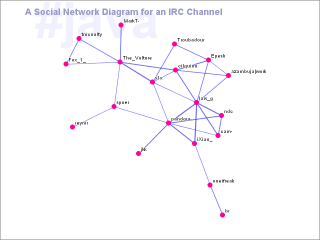
Figure 5. The evolving social network for #java
Figure 5 shows the inferred social network at a later moment in time. Newcomers to the channel have stolen the lead in centrality, illustrating the temporal nature of the social network.
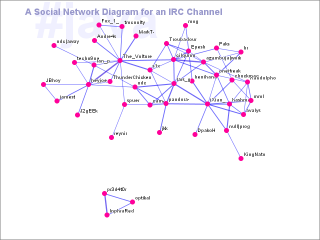
Figure 6. A disconnected social network for #java
Figure 6 shows a disconnected social network consisting of two maximally connected components. One of these components is a complete subgraph of three nodes, indicating that these three users have been talking only to each other. The other component represents the majority of the network, who were presumably not interested in participating in the other small discussion. Note that the m-limited alteration to the force model has caused the diagram to fit nicely within the view port, without causing a large separation between the two components.
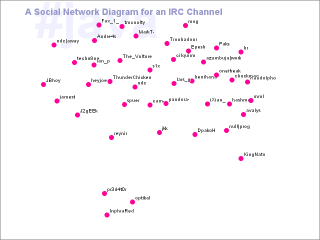
Figure 7. A social proximity representation for #java
As the social network grows in size, it may become difficult to understand the visualization. This occurs because the diagram becomes more complicated, with an increasing number of edges. One obvious approach to this problem is shown in figure 7, where the underlying social network is the same as that in figure 6, but the edges have not been drawn. This allows a viewer to imply the presence of relationships by judging proximity of nodes on the two dimensional plane. This layout shows potential for building a bridge between IRC and proximity-based chat systems, such as Chat Circles [Vie1999].
Future Work
Some interesting ideas for future work include integrating the current system into existing IRC clients to enhance their functionality, or to bridge the gap between proprietary chat systems and IRC. Visualizing other types of network data on IRC may also provide interesting research.
Integration with an Existing IRC Client
The existing system is written in pure Java and could therefore be altered to behave like an IRC client. Alternatively, it could be integrated with one of the many existing Java IRC clients. Such integration would provide the user with some powerful features. The user can not only view a diagram of the current social network for the channels they are in, but the inferred social networks could also be used to automatically filter out messages that the user may regard as irrelevant.
Spam Filtering on IRC
After a short period of training, the IRC client could be configured to only accept messages from trusted clients, that is, those clients contained in the same maximally connected component as the user. Messages from other components may be filtered as "spam". This feature could be of great benefit in very busy channels. The training period would simply involve using the channel for a short period without requiring any user configuration. If desired, the user may alter the spam detection settings by changing threshold values for relationship strengths, potentially changing the connectivity of the social network.
Trust Networks
The ability to infer social networks is useful in the study of trust networks, or to reinforce the findings of trust networks. Trust ratings can be inferred between users that are not directly connected to each other. This web of trust is the ultimate goal of the semantic web, which itself can be interrogated via an IRC interface with TrustBot [Gol2003].
Automatic FOAF Generation
The Friend of a Friend (FOAF) project aims to establish links between people and the things they do [Bri2003]. Each person must have a machine-readable homepage that can describe various attributes, including their links to other people. For a community of people on an IRC channel, the inferred social network could be used to create suitable machine-readable files automatically. FOAF files can be spidered to create a knowledge base, which can be accessed via an IRC interface with FOAFBot [Dum2002].
Bridging Chat Circles and IRC
Chat Circles [Vie1999] is a chat system that uses circular avatars on a two-dimensional plane to represent users. Each avatar can move freely about the plane. A pair of avatars can only hear each other if they are close enough. One criticism of the system is its lack of popularity compared with IRC, which typically has more than a million users at any one moment. Chat Circles is dependent on the notion of proximity to determine audibility by filtering, so it cannot be used to connect to a network of IRC servers, where there is no concept of proximity. One possible enhancement of Chat Circles would be to allow it to connect to IRC and use the inferred social networks to simulate the movement of avatars in each channel.
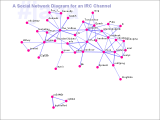
Channel Similarity Graphs
An individual IRC user may be present in several channels. This set of channels represents the interests of the user. If another user is present in a smaller subset of these channels, then there is a possibility that they may be interested in joining the other channels. This provides a channel discovery mechanism for those with similar interests. This type of visualization involves drawing a larger graph, using a similar method as before, but where each node now represents a channel. Edges are used to represent pairs of channels that share the same users, with each edge having a similarity weighting based on the number of shared users. Users of a specific channel can follow the emanating edges to discover similar channels. Some IRC servers may have tens of thousands of channels [Gel2003], thus requiring optimisation of the graph drawing process used by the bot. Embedding each maximally connected component separately can also lead to a performance gain, although it is difficult to piece these back together in an aesthetically pleasing way.
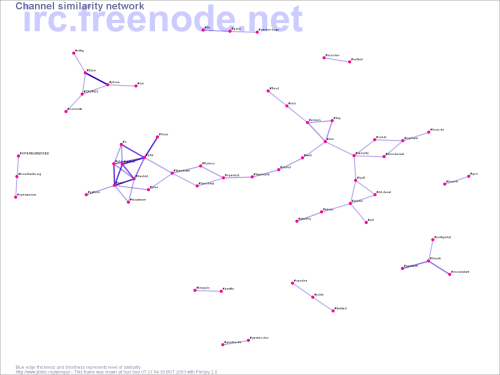
Figure 8. A channel similarity graph
Figure 8 shows a channel similarity graph for the freenode IRC network, showing the similarity between the most popular set of channels. This was produced with a modified version of PieSpy.
Conclusions
This paper has described an IRC bot that is able to connect to a network of IRC servers and infer social networks from a set of channels. The bot can produce drawings and animations of these social network diagrams on demand. A modified version of the bot can also be used to create channel similarity graphs.
Subjective Nature of Results
The accuracy of the social network diagrams is a subjective matter. Casual testing has shown participants to be happy with the output, often agreeing with what they interpret from the diagrams. It was extremely rare for any user to disagree with any aspect of the diagrams, so it would seem that the simple inference heuristics we use are fit for their purpose, however subjective that is.
Diagram Comprehension
Some of the diagrams may be easier to understand if there are fewer edge crossings. As there are no strict performance requirements in the current system, a simple and adequate solution would be to use a simulated annealing approach to avoid local minima and avoid unnecessary edge crossings. There is evidence to suggest that minimizing the number of edge crossings is an important factor in graph comprehension [Pur2001].
Future Work
Several ideas for future work have been discussed. All of these are certainly feasible. Some of them will act as better indicators of the accuracy of the system.
References
[Kre2002] Valdis Krebs. Introduction to Social Network Analysis, http://www.orgnet.com/sna.html (Accessed 14 October 2003).
[Mut2001] Paul Mutton. PircBot Java IRC Bot Framework, http://www.jibble.org/pircbot.php (Accessed 14 October 2003).
[Mut2002] Paul Mutton, Peter Rodgers. Spring Embedder Preprocessing for WWW Visualization. Sixth International Conference on Information Visualization (IV02), IEEE, pages 744-749, 2002.
[Mut2003a] Paul Mutton, Jennifer Golbeck. Visualization of Semantic Metadata and Ontologies. Seventh International Conference on Information Visualization (IV03), IEEE, pages 300-305, 2003.
[Mut2003b] Paul Mutton. PieSpy Social Network Bot. http://www.jibble.org/piespy/ (Accessed 14 October 2003).
[Vie1999] Fernanda B. Viegas, Judith S. Donath. Chat Circles, CHI 1999, pages 9-16, 1999.
[Gel2003] Andreas Gelhausen. Summary of IRC Networks, http://irc.netsplit.de/networks/ (Accessed 14 October 2003).
[Oik1993] Jarkko Oikarinen. RFC 1459 - Internet Relay Chat Protocol, http://www.faqs.org/rfcs/rfc1459.html (Accessed 14 October 2003).
[Wel1997] Barry Wellman. An Electronic Group is Virtually a Social Network. Culture of the Internet, pages 179-205, 1997.
[Mun1995] T. Munzer and P. Burchard. Visualizing the Structure of the World Wide Web in 3D Hyperbolic Space. VRML 1995, special issue of Computer Graphics, ACM SIGGRAPH, pages 33-38, 1995.
[Par1998] G. Parker, G. Frank, C. Ware. Visualization of Large Nested Graphs in 3D: Navigation and Interaction. Journal of Visual Languages and Computing, 9(3), pages 299-317, 1998.
[Wil1999] G.J. Wills. NicheWorks - Interactive Visualization of Very Large Graphs. Journal of Computational and Graphical Statistics 8, 2, pages 190-212, 1999.
[Ead1984] Peter Eades. A Heuristic for Graph Drawing. Congressus Numerantium 42, pages 149-160, 1984.
[Fru1991] T.M.J. Fruchterman, E.M. Reingold. Graph Drawing by Force-Directed Placement. Software - Practice and Experience Vol. 21(11), pages 1129-1164, 1991.
[Har2001] D. Harel, Y. Koren. A Fast Multi-scale Method for Drawing Large Graphs. GD 2000, LNCS 1984, pages 183-196, 2001.
[Qui2001] Aaron. Quigley, Peter Eades. FADE: Graph Drawing, Clustering and Visual Abstraction. GD 2000, LNCS 1984, pages 197-210, 2001.
[Tun1998] D. Tunkelang. JIGGLE: Java Interactive Graph Layout Algorithm. GD 1998, LNCS 1547, pages 413-422, 1998.
[Wal2001] C. Walshaw. A Multilevel Algorithm for Force-Directed Graph Drawing. GD 2000, LNCS 1984, pages 171-182, 2001.
[Dum2002] Edd Dumbill. FOAFBot: IRC Community Support Agent. http://usefulinc.com/foaf/foafbot (Accessed 14 October 2003).
[Bri2003] The FOAF Project. http://www.foaf-project.org/ (Accessed 14 October 2003).
[Gol2003] Jennifer Golbeck, Bijan Parsia, James Hendler. Trust Networks on the Semantic Web. Proceedings of Cooperative Intelligent Agents, pages 238-249, 2003.
[Pur2001] H.C. Purchase, L. Colpoys, M. McGill, D. Carrington, C. Britton. UML class diagram syntax: an empirical study of comprehension. Proceedings of the Australian Symposium on Information Visualization, Australian Computer Society, pages 113-120, 2001.
PieSpy Links
I have noticed several people using PieSpy and placing their output on the web. It would be great if you could link back to this site when you do this. If you would like me to link to your output, please contact me and let me know where it is.
Here are some known links (some may have moved):
- http://www.loka.info
- http://hengo.is-a-geek.net/schreinerei/img/society/cyberscripters/
- http://www.cs.kent.ac.uk/people/rpg/ads3/snob/pie-current.png
- http://www.ricebox.org/qed/
- http://punkfi.ath.cx/vonkausverkko/
- http://home.twistedkids.com/index.php?i=stats
- http://www.mscorlib.com/social/
- http://www.sirvulcan.org/~vulcan/piespy/mircscripting/
- http://helium.wakkanet.fi/~mpinfo/piespy.htm
- http://snd.cheza.no-ip.com/ayumi/
- http://www.stremler.net/temp/solaris.html
- http://www.nerd-out.com/kplugirc/piespy/index.html
- http://fennec.homedns.org/piespy.html
- http://freebsd.so14k.com/~lofi/
- http://blitzed.eu.org/piespy
- http://penguin.powersource.cx/~tom/PieSpy
- http://koti.welho.com/jkolehma/pics/imperiumi/imperiumi-current.png
- http://www.maxheadroom.nu/piespy/
- http://www.gospelnet.fi/piespy/
- http://dita.tky.hut.fi/piespy/
- http://213.67.222.212/piespy/
- http://tekno.humppa.jyu.fi:800/piespy/
- http://irc.amigafin.org/?topic=stats&type=piespy
- http://tite1a.shacknet.nu/rapellys-current.png
- http://kiksu.doc.info/
- http://luzmu.exclusionzone.org/stats/ircnet/bittivuoto/bittivuoto-current.png
- http://rootcrew.net/~gefla/karlsruhe-current.png
- http://www.stremler.net/IRC/
- http://mikewren.com/irc/
- http://mau.ton.tut.fi/~atnuuski/pie/nokiagame.fi/nokiagame.fi-current.png
- http://tweak.homelinux.net/~brant/piespy/
- http://dm.my1337.net/PieSpy/Landoleet/
- http://members.dslextreme.com/users/drunkenmaster/PieSpy/
- http://www.scriptingnet.org/stats/scripting/
- http://www.afternet.org/piespy/linux/
- http://aetherbot.no-ip.com/
- http://nickstallman.net/piespy/
- http://solidirc.com/social-networking.html
Petr Baudis has converted PieSpy 0.2.4 into an Irssi script. Neat!
Ville H. Tuulos and Henry Tirri (from the Complex Systems Computation group at the Helsinki Institute for Information Technology) have produced a PieSpy-inspired paper entitled Combining Topic Models and Social Networks for Chat Data Mining. I like this!
PieSpy is also featured in the O'Reilly book IRC Hacks. Go buy it :)
Licensing
This software product is OSI Certified Open Source Software, available under the GNU General Public License (GPL). Since the GPL may be too restrictive for use in proprietary applications, a commercial license is also provided.
Purchase a commercial license for this software.
Search this site
Copyright Paul Mutton 2001-2013
http://www.jibble.org/
Feedback welcomed
![]()